Final Election Prediction
Oct 30, 2020
Throughout this past semester, I have analyzed the relationship between variables such as second-quarter GDP, incumbency status, and turnout with a presidential candidate’s popular vote share. However, no single variable has been more related or more predictive of a candidate’s populate vote share than a candidate’s average support in the polls. Given my “best” models have consistently relied on such a variable, I will primarily base my final prediction model for 2020 on a candidate’s average support.
The Average Support Model
My model consists of a linear regression between the popular vote share and average support for either the Democratic or Republican presidential candidates. I constructed such regression based on popular vote and average support data from 1968 to 2016, or the past 13 presidential election cycles. The model necessarily excludes other variables, like second-quarter GDP, given the incorporation of such variables results in an ambiguous or non-significant improvement in the model’s predictive ability. The formulas and coefficients for both the Democratic and Republican candidate average support models are demonstrated below:
-
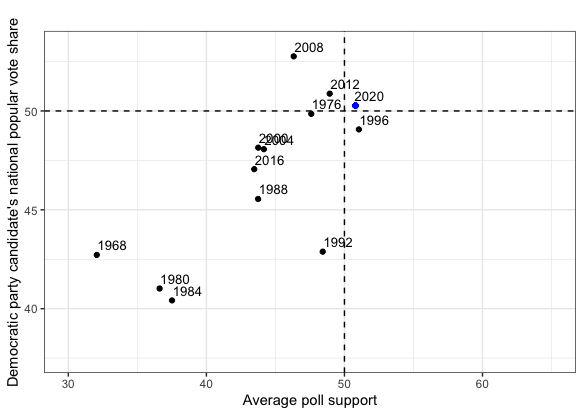
Democrat average support model. For Democratic candidates, the linear regression model formula based on average support is: predicted popular vote share = 23.4186 + 0.5286 (average support). Thus, for every 1% increase in the average support for a Democratic presidential candidate, such a candidate’s predicted popular vote share increases by 0.5286 percentage points.
-
Republican average support model. For Republican candidates, the linear regression model formula based on average support is: predicted popular vote share = 12.5561 + 0.7829 (average support). Thus, for every 1% increase in the average support for a Republican presidential candidate, such a candidate’s predicted popular vote share increases by 0.7829 percentage points. The formula also indicates my average support model predicts a greater increase in the popular vote share for Republican candidates relative to Democratic candidates when their respective support in the polls rises.
Model Validation
| Model | Party | R-squared | Mean Squared Error | Leave-One-Out Validation | Cross Validation |
|---|---|---|---|---|---|
| Average Support Model | Democrat | 0.64 | 2.63 | -0.72 | 1.59 |
| Average Support Model | Republican | 0.72 | 3.35 | -0.09 | 1.98 |
The in-sample and out-of-sample performance of my model are summarized in the table above. Some of the major takeaways include:
-
In-sample fit. The in-sample fit for the average support model is relatively strong for both parties, with neither party’s model having a significantly greater fit than the other. While the Republican candidate average support model has a larger r-squared value than the Democratic candidate model, the Democratic candidate average support model has a lower mean squared error than the Republican candidate average support model.
-
Out-of-sample error. The out-of-sample error for the average support model is not large either. In fact, the leave-one-out validation value for the Republican candidate average support model is only -0.09. However, the Democratic candidate average support model has the lower cross-validation value of the two parties.
Ultimately, such validations demonstrate that both parties’ average support models perform relatively well, considering both their in-sample fit and out-of-sample error.
National Election Predictions for 2020
Democratic Candidate 2020 Predicted Vote Share | Republican Candidate 2020 Predicted Vote Share
:————————-:|:————————-:
 |
|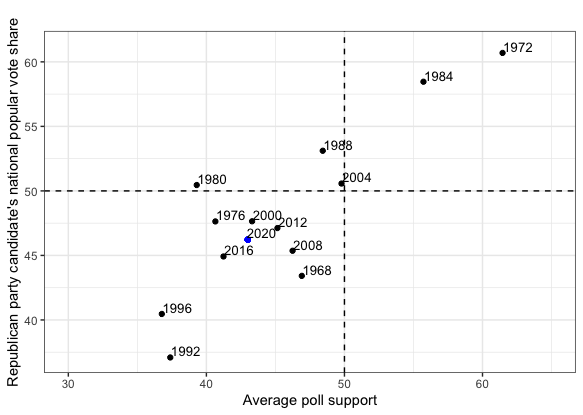
Using the average support model, the above graphs demonstrate my prediction for the 2020 candidates’ vote shares (with the blue dot denoting such prediction). While my model projects that the Republican candidate, Donald Trump, will receive 46.22% of the popular vote, the Democratic candidate, Joe Biden, is projected to receive 50.27% of the popular vote. This translates to Trump receiving 47.9% of the two-party popular vote share and Biden receiving 52.1% of the two-party popular vote share.
Of course, such prediction does not come without some uncertainty. The predictive interval associated with Trump’s projected popular vote share is between 37.86% and 54.57%. Moreover, the predictive interval associated with Biden’s projected popular vote share falls between 43.39% and 57.15%.
State-Level Election Predictions for 2020
I similarly applied my average support model to each state, using the Democratic and Republican candidates’ state-level average support to predict their state-level 2020 popular vote shares. I relied on the formula and coefficients of the average support model on the national level instead of running a linear regression between a candidate’s popular vote share and average support in each state due to the limited/lack of historical popular vote and average support data on the state level.
| Projected Win Margins Map for 2020 |
|---|
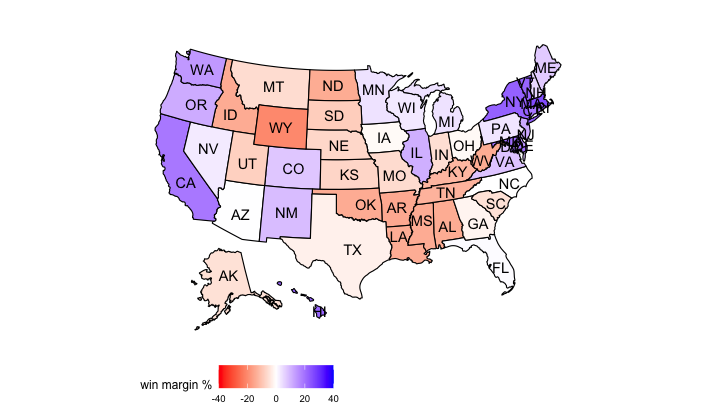 |
The map above demonstrates Biden’s projected two-party popular vote win margins in each state. Biden’s win margins were constructed using the difference between Biden’s predicted two-party popular vote share and Trump’s predicted two-party popular vote share. The blue states indicate the states where Biden is projected to get the majority of the two-party popular vote share, while the red states indicate the states where Trump is projected to attain the majority of the two-party popular vote share. Ultimately, my average support model and the resulting win margins in each state indicate that Biden is projected to receive 319 electoral votes, and Trump is predicted to attain 219 electoral votes.
Similar to the national popular vote predictions, there are uncertainties with the state-level predictions. Aside from the aforementioned predictive intervals, one must consider that the average support data for the 2020 candidates in each state is varied; some states have better and more frequent polling, while others do not.
Final Takeaways
Ultimately, my linear regression model based on average support projects a Biden win, with the Democratic candidate taking 52.1% of the two-party popular vote share and 319 electoral votes. Of course, such prediction is not without its uncertainty, but the model’s strong in-sample and out-of-sample performance for both Democratic and Republican candidates indicate that the model’s afromentioned predictions have some validity. Additional data from future elections, including 2020, will continually improve my model and its predictive ability.