Turnout in Popular Vote Predictions
Oct 16, 2020
Campaigns have employed many strategies to mobilize their base and increase voter turnout throughout past presidential elections (Enos). This begs the question: how can turnout help predict a candidate’s popular vote share? In this blog, I will seek to answer such a question. I will first consider trends in turnout as a percentage for the voting-eligible population for the presidential and midterm elections. I will then incorporate this turnout variable in a linear regression model, stratified by party affiliation, and compare it to models from previous weeks. Finally, I will use this new model to predict the 2020 election, considering several turnout scenarios.
Turnout Trends in the United States
| United States Presidential Election Turnout (1980-2016) | United States Midterm Election Turnout (1982-2014) |
|---|---|
 |
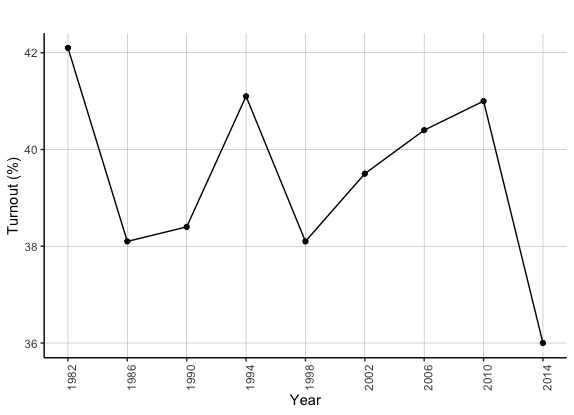 |
The graphs above demonstrate trends in the turnout rate (as a percentage of the voting-eligible-population) for United States elections from 1980 to 2016. Some of the major takeaways include:
-
Increasing turnout for presidential elections. From the data available, the voter turnout rate for presidential elections has generally increased from 1980 to 2016. This is evident given that the turnout rate for most elections before 2000 fell below 55% while such rate was above 59% for the majority of elections post-2000.
-
Decreasing turnout for midterm elections. From the data available, the turnout rate for midterm elections has generally decreased from 1982 to 2014. This is evident given that the turnout rate for midterm elections peaked around 42% in 1982 and fell to around 36% in 2014. However, one should note that the turnout rate increased consistently from 1988 to 2010 and was likely significantly higher in 2018 relative to 2014.
Incorporating the Turnout Rate in Models and Model Comparisons
I will now incorporate the turnout rate of presidential elections in a model that predicts candidates’ vote share. The main model I will consider is a linear regression model that factors in the turnout rate for presidential elections from 1980 to 2016 and the average support for a candidate six weeks before the election. A candidates’ average support is factored in the model given such was found to be the most predictive variable for a candidate’s popular vote share in my week 3 blog. I will compare the afromentioned model to a linear regression model based solely on the average support for a given candidate. Each model will be separated by party, i.e., each model will have two versions that predict the vote share for a candidate from one of the two major parties, using the same linear regression formula but with average support data specific to each party’s candidate.
| Model | Variable(s) | Party | R-squared | Mean Squared Error | Cross Validation |
|---|---|---|---|---|---|
| 1 | Average Support, Turnout Rate | Democrat | 0.56 | 2.58 | 3.27 |
| 1 | Average Support, Turnout Rate | Republican | 0.82 | 2.47 | 2.85 |
| 2 | Average Support | Democrat | 0.47 | 2.83 | 2.73 |
| 2 | Average Support | Republican | 0.71 | 3.13 | 3.18 |
The table above demonstrates the in-sample fit, via variables like r-squared and the mean squared error, and out-of-sample error, via the cross-validation values, for each of the previously mentioned models.
In-sample fit. The in-sample fit for model 1 is better than the in-sample fit for model 2 for Democratic and Republican party candidates. This is given the r-squared values are higher, and the mean squared error values are lower for model 1 relative to model 2 for both parties.
Out-of-sample error. The out-of-sample error for model 1 is greater than model 2, considering only Democratic party candidates. Such is evident via the greater cross-validation value for model 1 relative to model 2 for Democratic party candidates. However, the out-of-sample error is lower for model 1 relative to model 2, considering Republican candidates. Such is evident via the lower cross-validation value for model 1 relative to model 2 for Republican candidates.
Ultimately, model 1 provides a better in-sample fit but greater out-of-sample error relative to model 2, concerning Democratic party candidates. Meanwhile, model 1 provides a better in-sample fit and less out-of-sample error than model 2, concerning Republican candidates. Thus, one could claim incorporating turnout in a linear regression model based on a Republican candidate’s average support could increase such a model’s predictive ability.
Predictions for 2020 Candidates
I will now use the model based on a candidate’s average support and voter turnout, model 1, to make predictions for each candidate’s popular vote share in 2020. Given the turnout rate for 2020 is unknown, I will provide a series of predictions based on several different turnout scenarios.
Business as usual. Given voters turn out at a rate similar to last election cycle, or the “business as usual scenario,” the turnout rate would be around 60%. In this scenario, factoring in each candidate’s average support, model 1 predicts Biden will attain 52% of the popular vote. Furthermore, under this model, Trump would achieve 43.7% of the popular vote.
Historic lows. Given voters turn out at a much lower rate due to COVID, which I will assume would fall just under previous historic lows, the turnout rate would be around 51%. In this scenario, model 1 predicts Biden will attain about 49% of the popular vote. Furthermore, under this model, Trump would achieve 48.7% of the popular vote.
Large turnout. Given voters turn our at a higher rate due to the advent of mail-in votes, and large mobilization, which I will assume would reach near historic highs, the turnout rate would be around 61%. In this scenario, model 1 predicts Biden will attain about 52.7% of the popular vote. Furthermore, under this model, Trump would achieve 42.6% of the popular vote.
Final Takeaways
In this blog, I used the turnout rate of presidential elections to help predict the 2020 election. After incorporating the turnout rate in a linear regression model with average support, I evaluated such a model against my week 3 model based solely on a candidate’s average support. Ultimately, the new model had a lower out-of-sample error considering Republican candidates than my week 3 model. When predicting the 2020 election, my new model predicts Biden will beat Trump by a substantial margin given the “business as usual” and large turnout scenarios. Only under a historically low turnout scenario does my model anticipate a very tight race between Biden and Trump. Future models should incorporate the turnout rate with other variables, especially considering predicting the popular vote for Republican candidates.